2022 marked some of the first big changes to the FRS retirement plans since 2011. We saw investment...
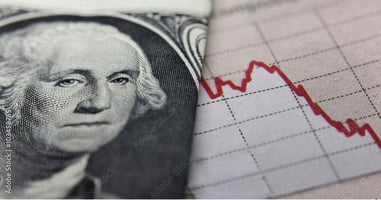
The market goes down sometimes. In fact, it happens somewhat frequently. That being said the average annualized rate of return for the S&P500, a somewhat broad index that many investors use to gauge the market, has averaged around 10% year over year for the past 50+ years. So how is this possible when the market often has negative quarters like we are currently experiencing, and all those bad years we mentioned? Well, the simple answer is, overtime the market charges higher. Let's look at the years following the 2008 market crash. In that year the market had a 37% loss, but, what many individuals don't realize is that the following 9 years after that were all positive, with 7 of those years being double digit returns. The highest of which was a 32% return in 2013. Unfortunately, this run ended in 2018 when a bad 4th quarter took the market negative for the year, and the market posted a roughly 4% loss. After which though, the growth continued. In 2019, 2020, and 2021, the market was again positive. 2020 was a notably impressive year considering that the Covid pandemic temporarily took the market down almost 34% from Feb 19-March 23. You can see this on the chart below.

With the market declining this much, it may be surprising to note that by year end, not only had the market recovered, but 2020 posted an 18% return for the year!
The story continues. In 2022, the market posted it's worst performing year since the 2008 recession. A painful 18% loss for the S&P500 by year's end. What happened next though? In 2023 and 2024 the market returned just over a 25% return in EACH of those 2 years.
So, what's the overall lesson to be learned here? For me it's that focusing on the bad years, or getting highly concerned during times of extreme market volatility can be detrimental to long term goals and performance. This also shows the importance of having a long term portfolio, built to reflect your risk tolerance and goals.
Sources:
https://www.slickcharts.com/sp500/returns
https://www.investopedia.com/ask/answers/042415/what-average-annual-return-sp-500.asp
https://finance.yahoo.com/quote/SPY/
The S&P 500 is a market-cap weighted index composed of the common stocks of 500 leading companies in leading industries of the U.S. economy.
Past Performance - Investment returns for prior historical periods may not be indicative of future returns. No client should assume that future results will be profitable or directly correspond to the performance results of any comparative benchmark or composite.